2023 Nov W4 – 2024 Taiwan Presidential Election Information Manipulation AI Observation Report
Insights on manipulation strategies
This week, following the collapse of the KMT-TPP alliance, there was a noticeable surge in mutual criticisms between the KMT and TPP across various platforms, with the attack intensity recorded as follows: Facebook at 12.9%, YouTube at 23.7%, PTT at 26.7%, and TikTok at 26.7%. Notably, on YouTube, criticisms were more heavily directed at the KMT than TPP, whereas on other platforms, Ko Wen-je was the primary target.
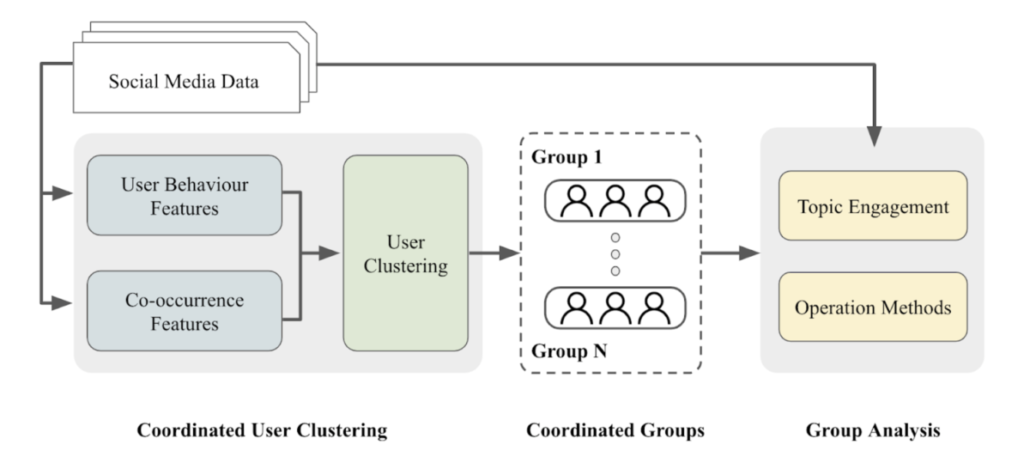
An analysis of the two most active Facebook troll groups, 61009 and 61019, revealed similar patterns in their active periods and targets of criticism. Both troll groups suddenly became active on September 6th, the day candidate Terry Gou announced his running for election. They are active in similar stories and predominantly critiqued the KMT, the DPP, and Ko Wen-je, accounting for an average of 15% of their content, with relatively lesser focus on Terry Gou.
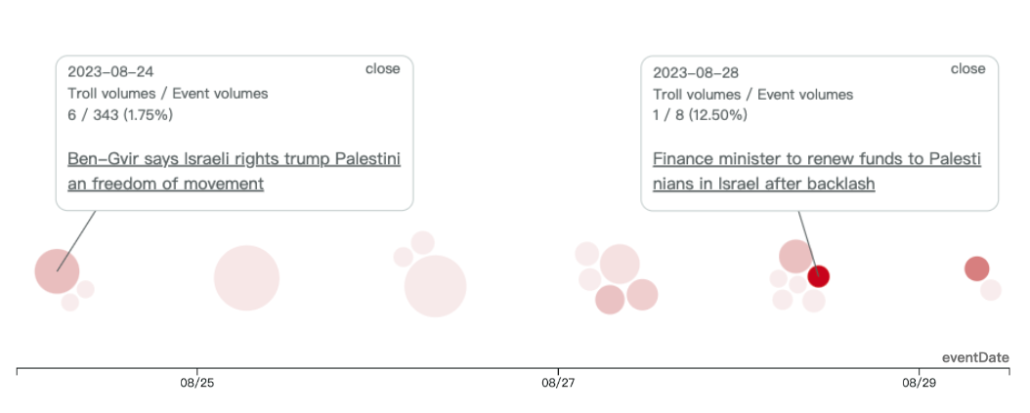
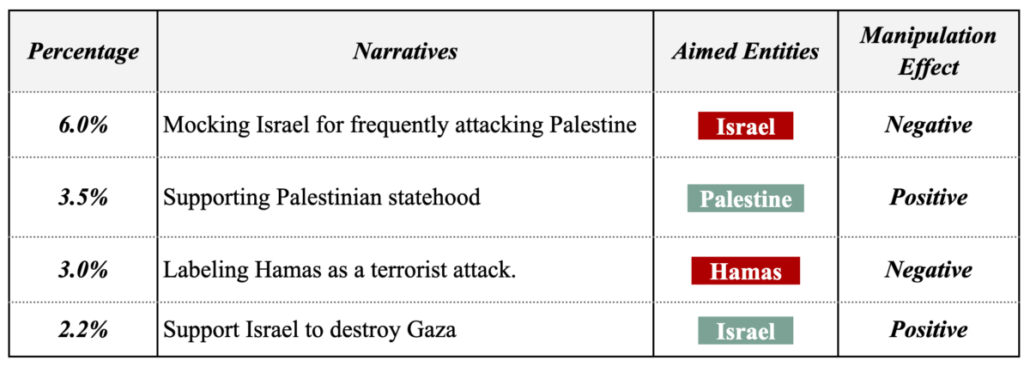
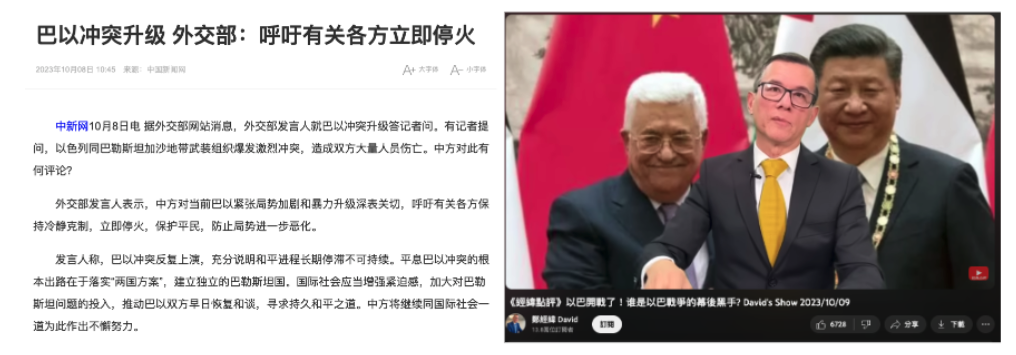
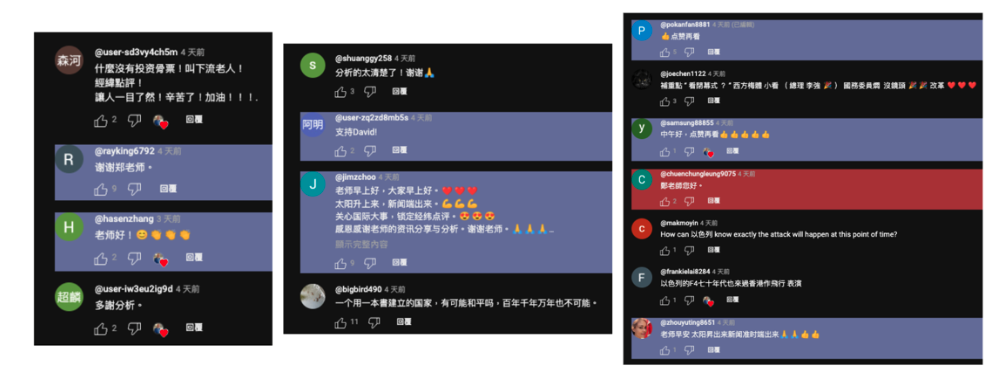
Throughout this week, Tsai Ing-wen’s Facebook fan page became a hotspot for a large number of coordinated comments. Some of these comments echoed the China state-affiliated media’s narrative, suggesting that the DPP’s ascension to power could escalate military tensions and conflict risks. Simultaneously, narratives favoring the KMT appeared on PTT, YouTube, and TikTok, which subsequently found resonance in the narratives pushed by Chinese state-affiliated media.
Download Full Report:2023 Nov W4 -2024 Taiwan Presidential Election Information Manipulation AI Observation Report